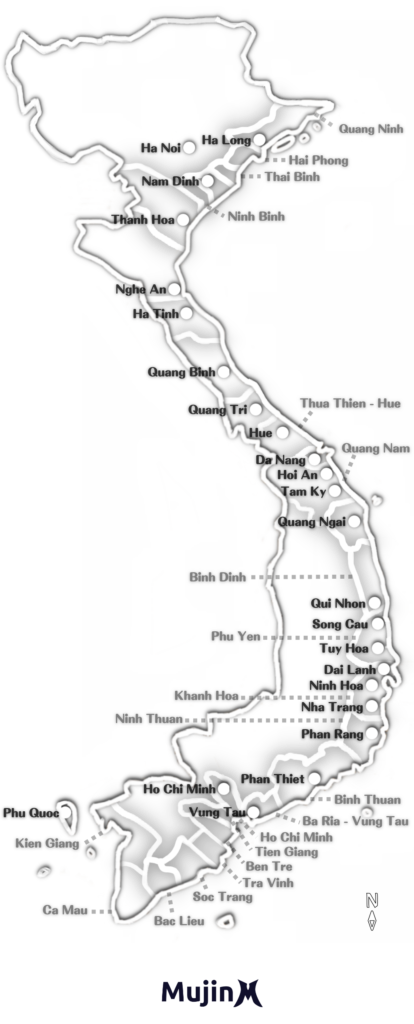

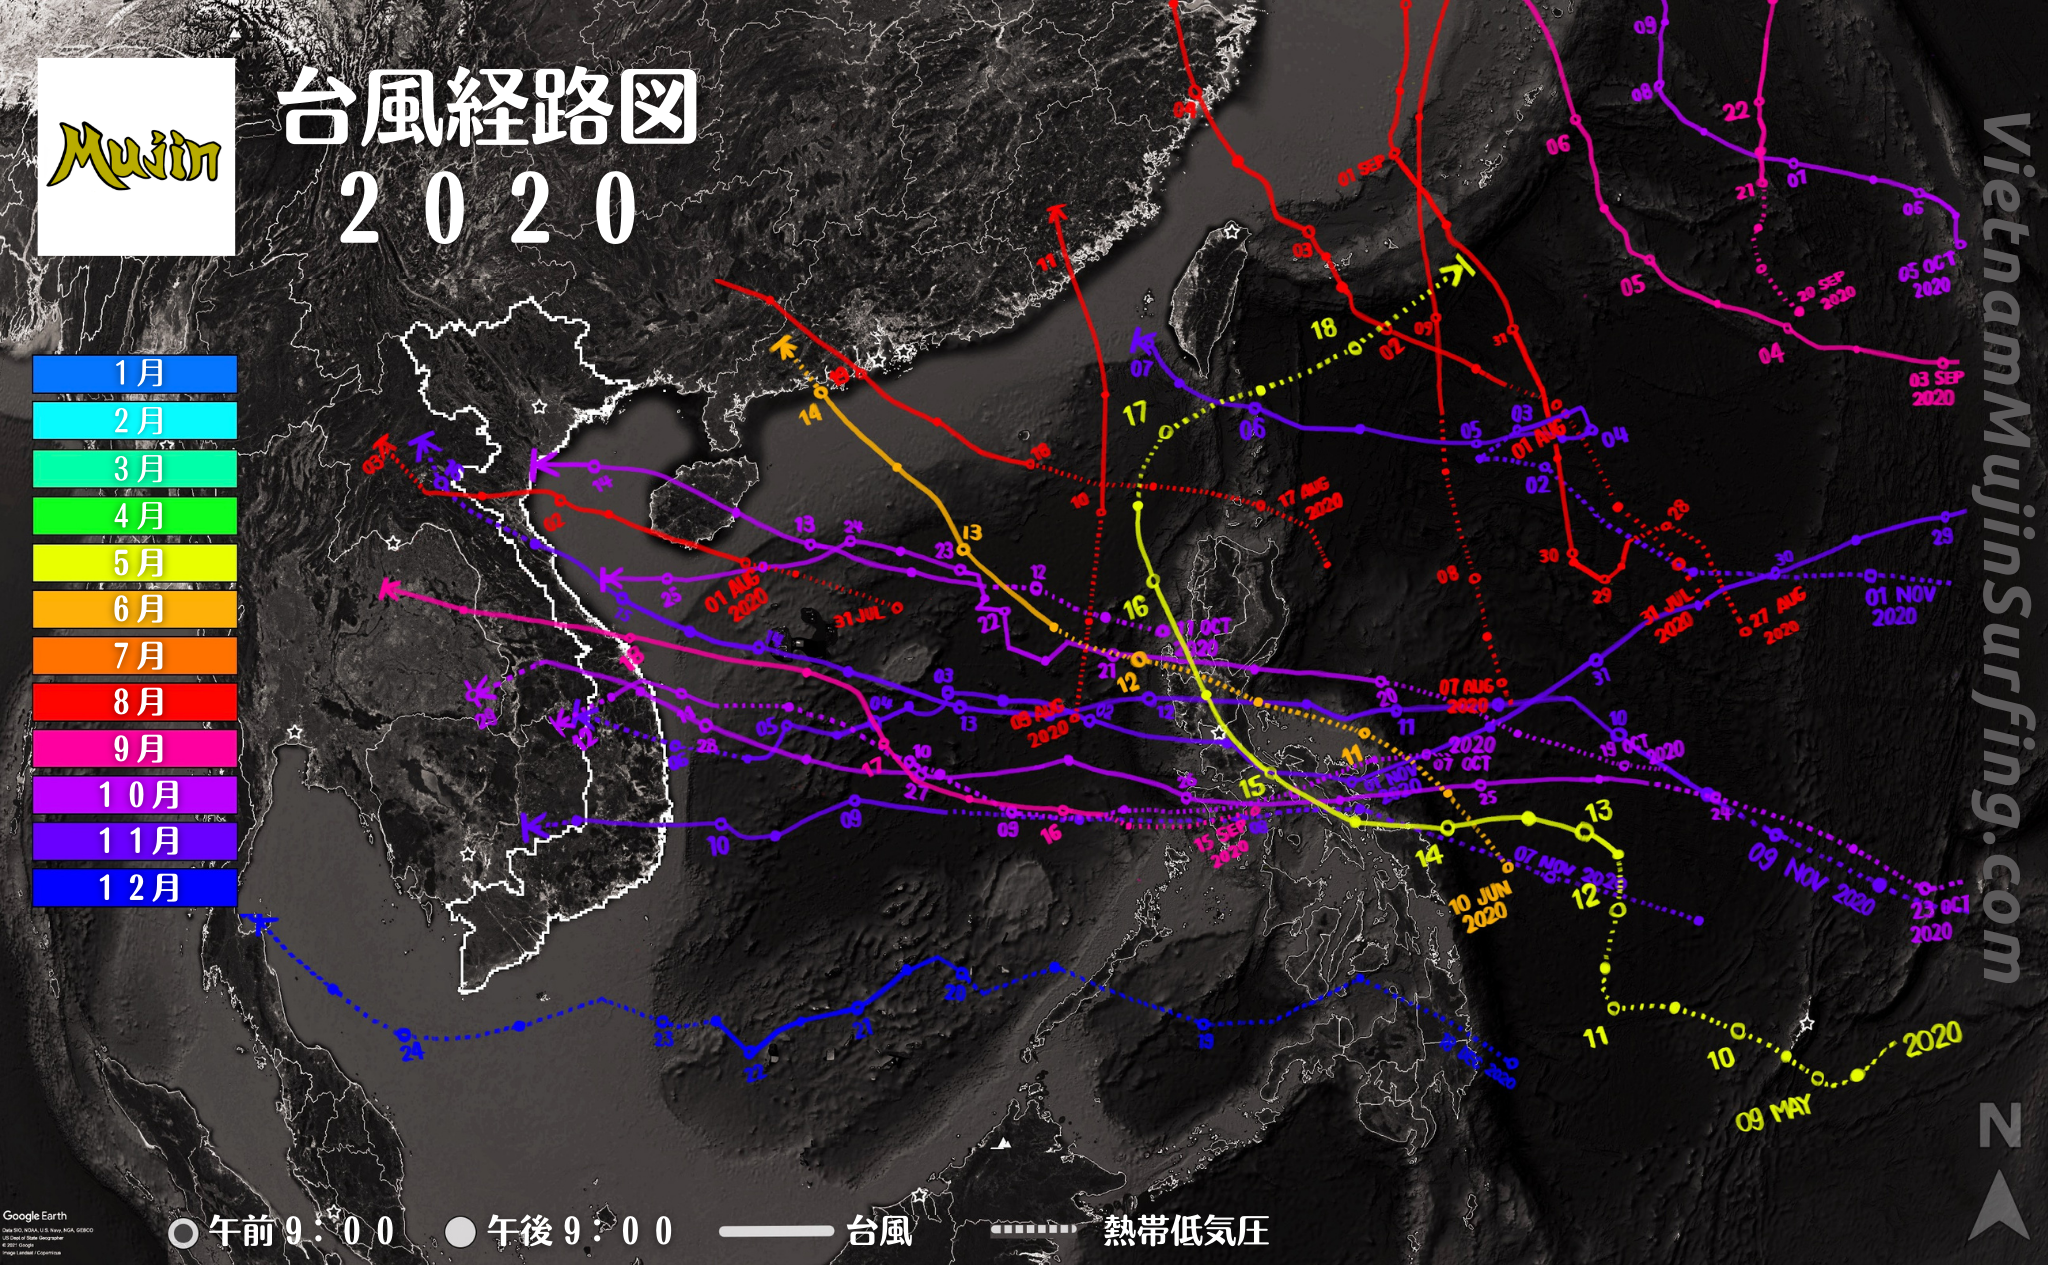
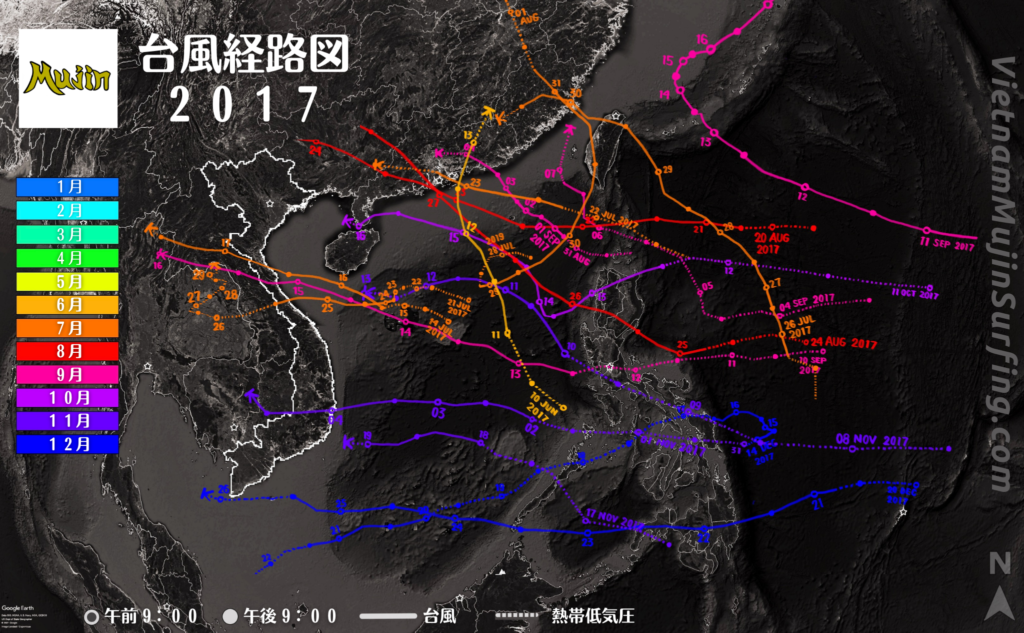
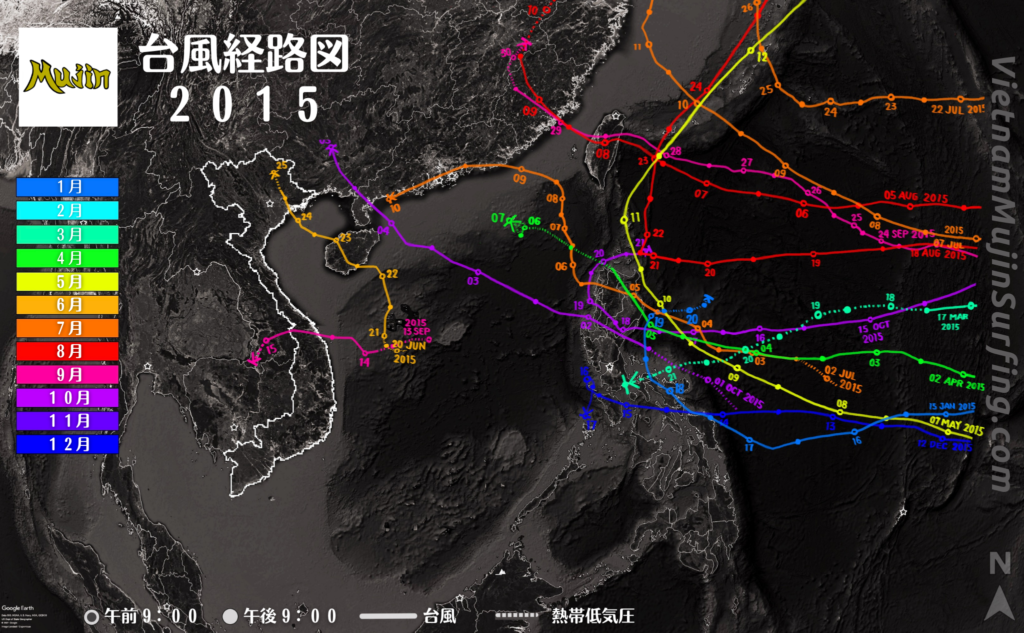
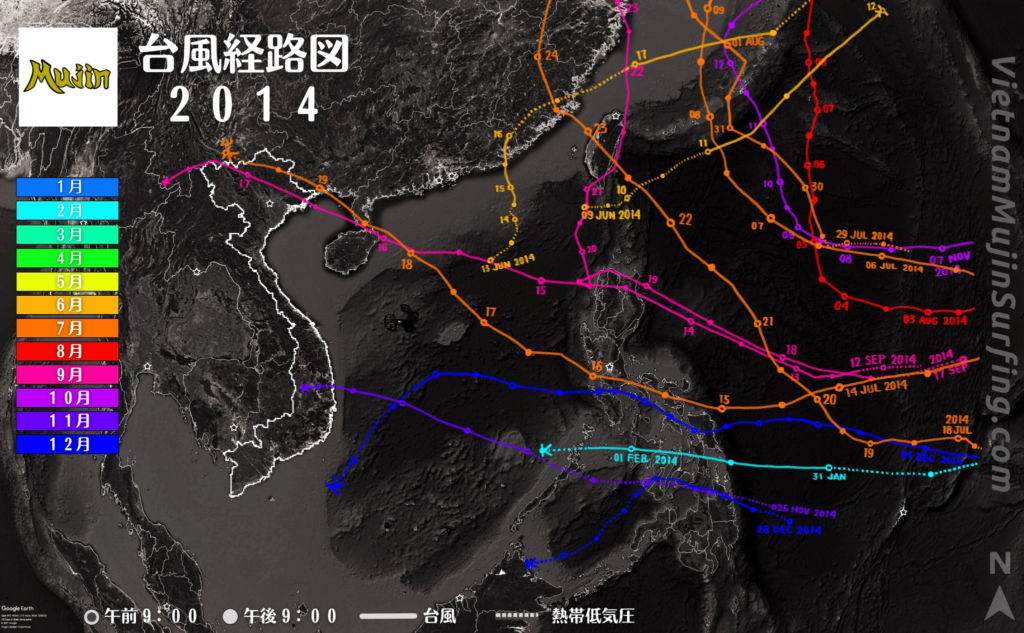
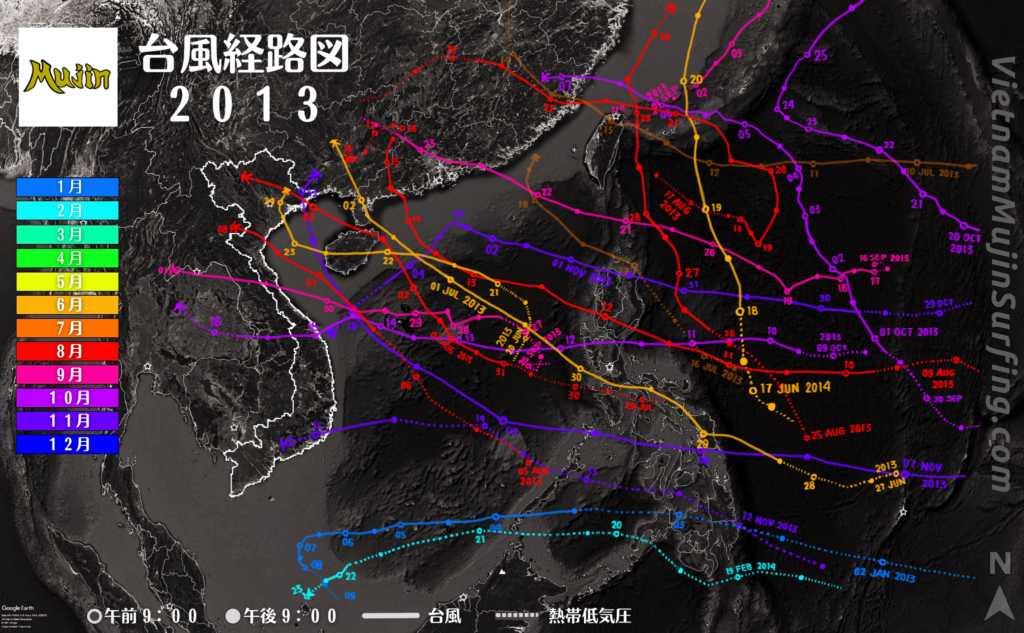
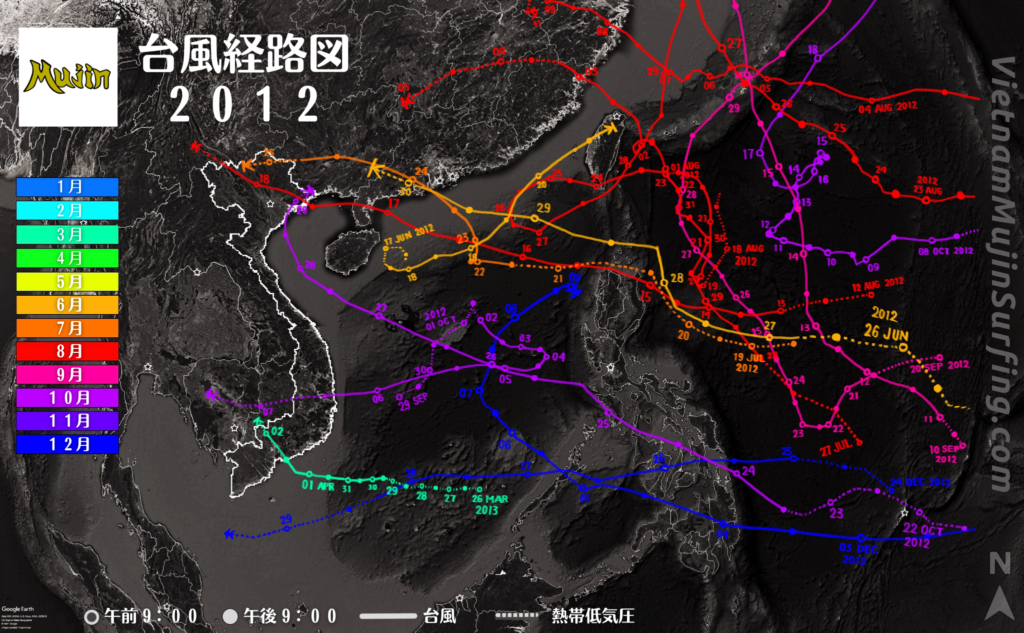
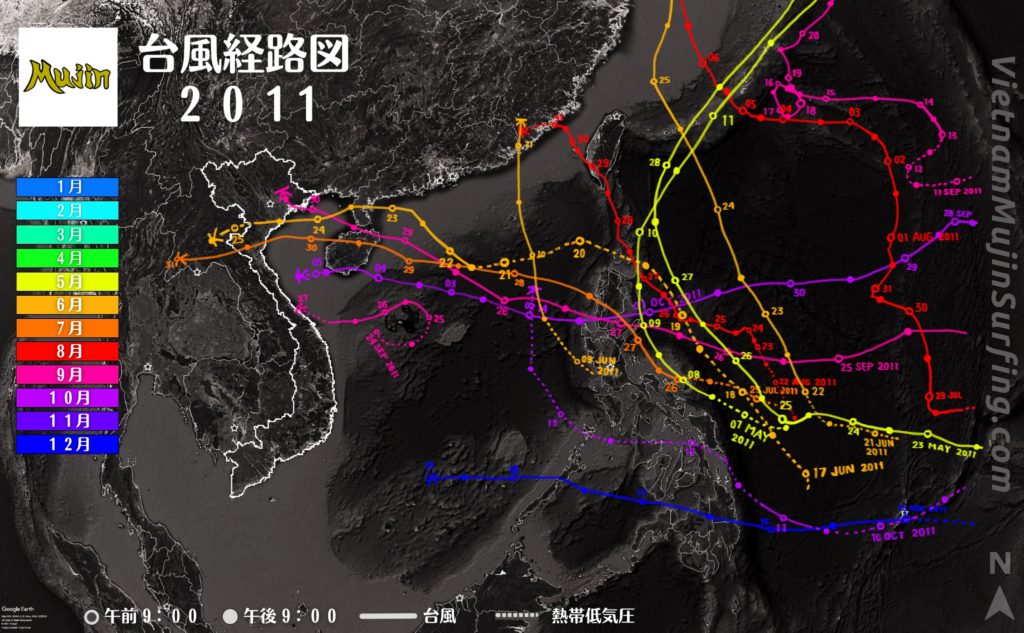
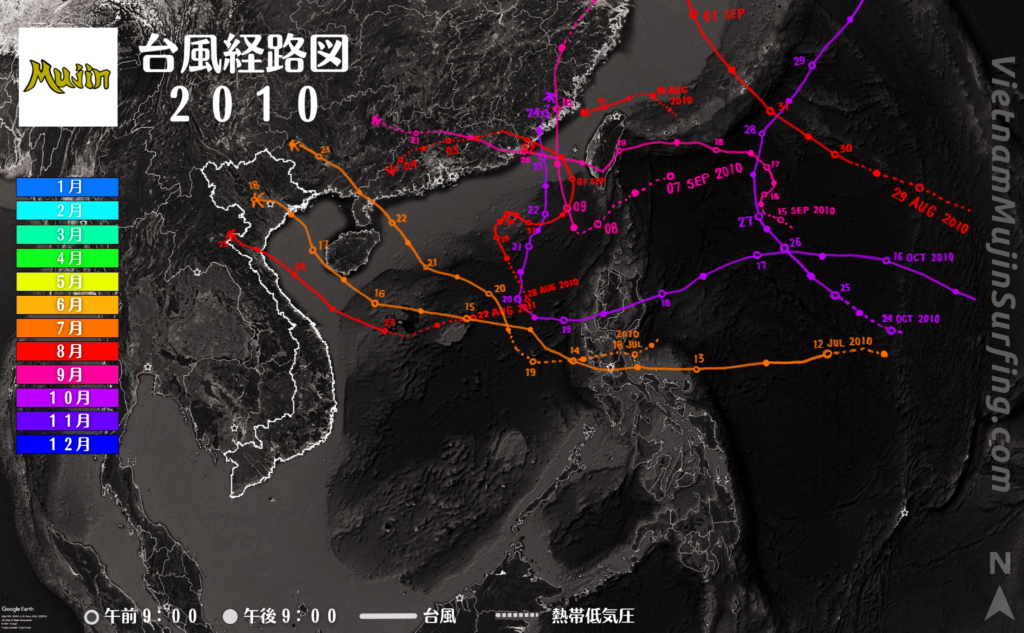
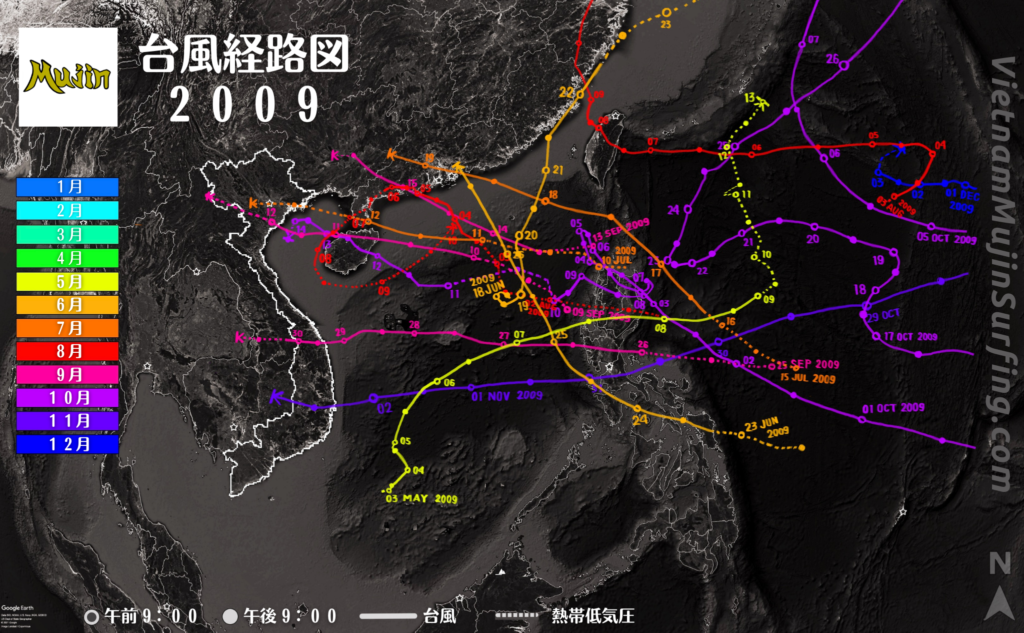
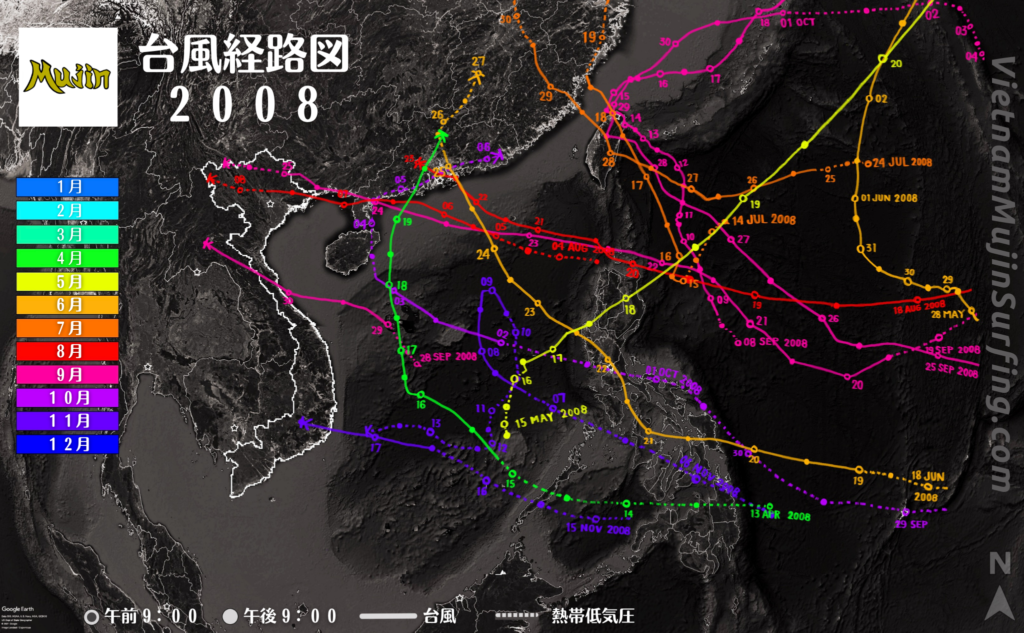
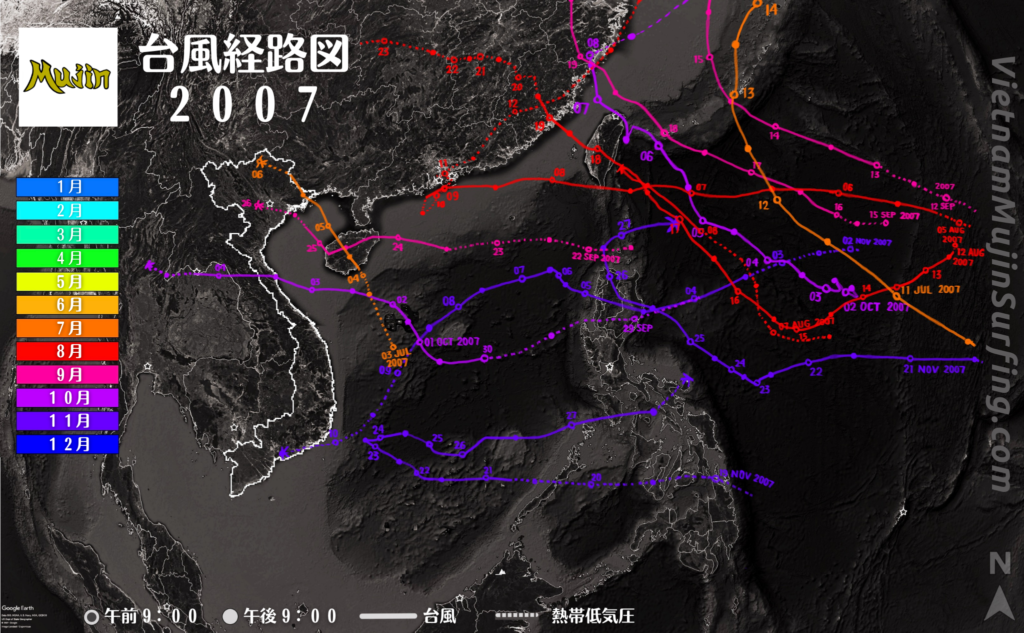
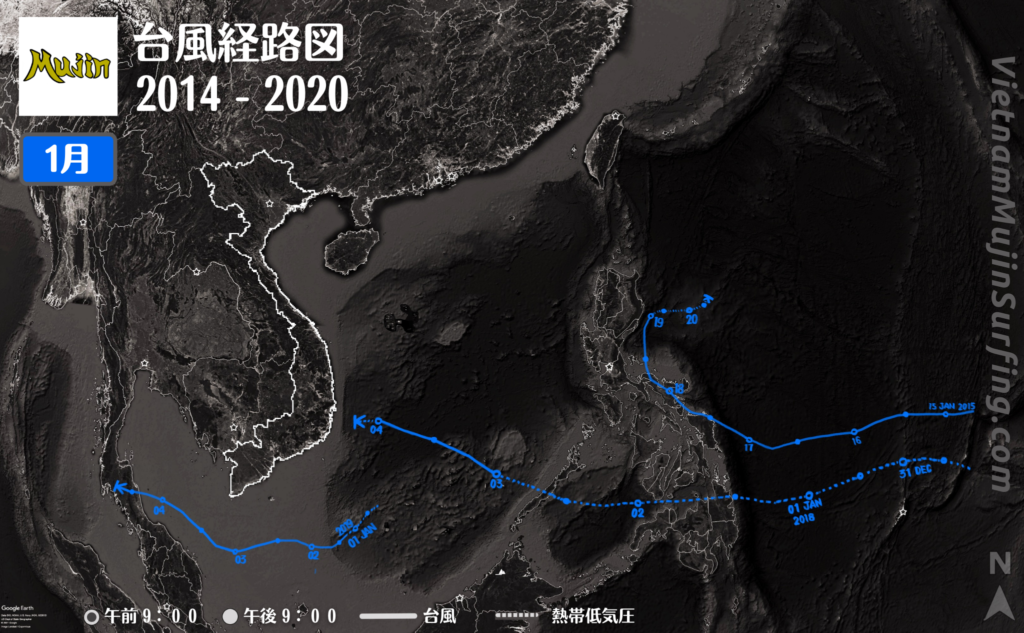
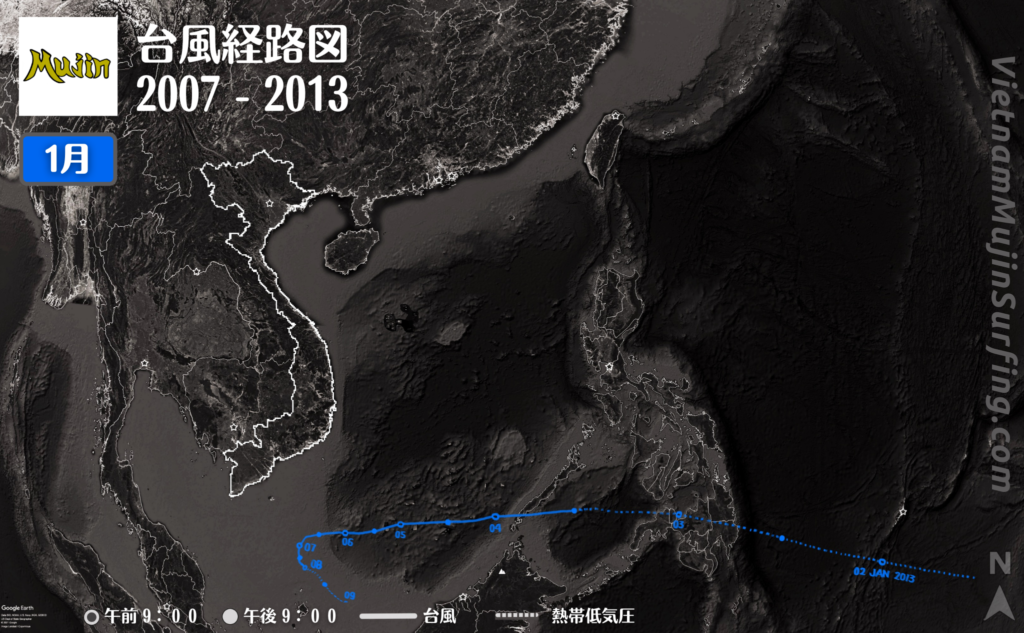
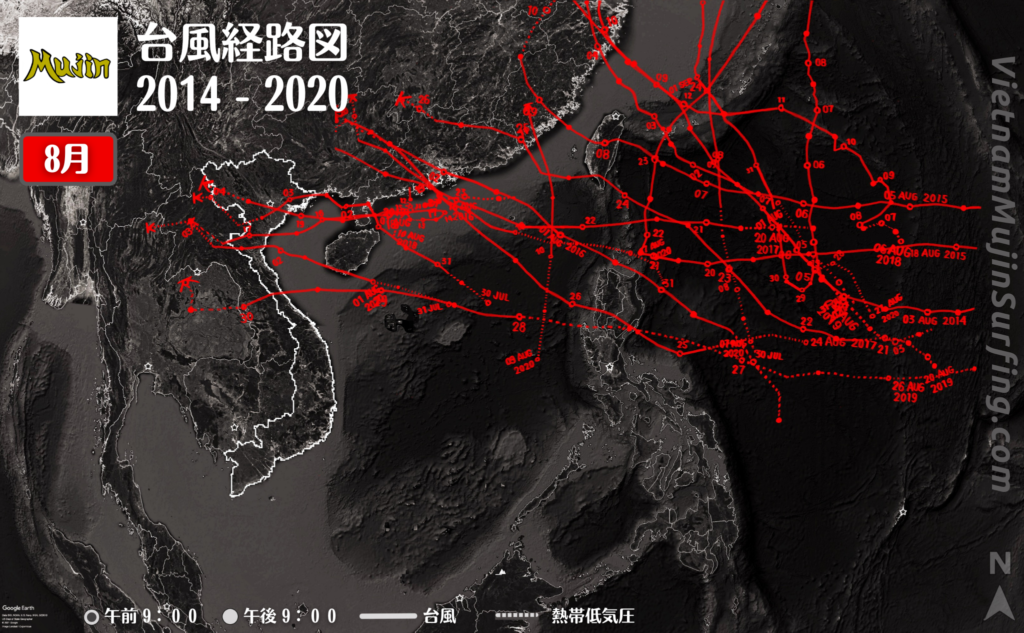
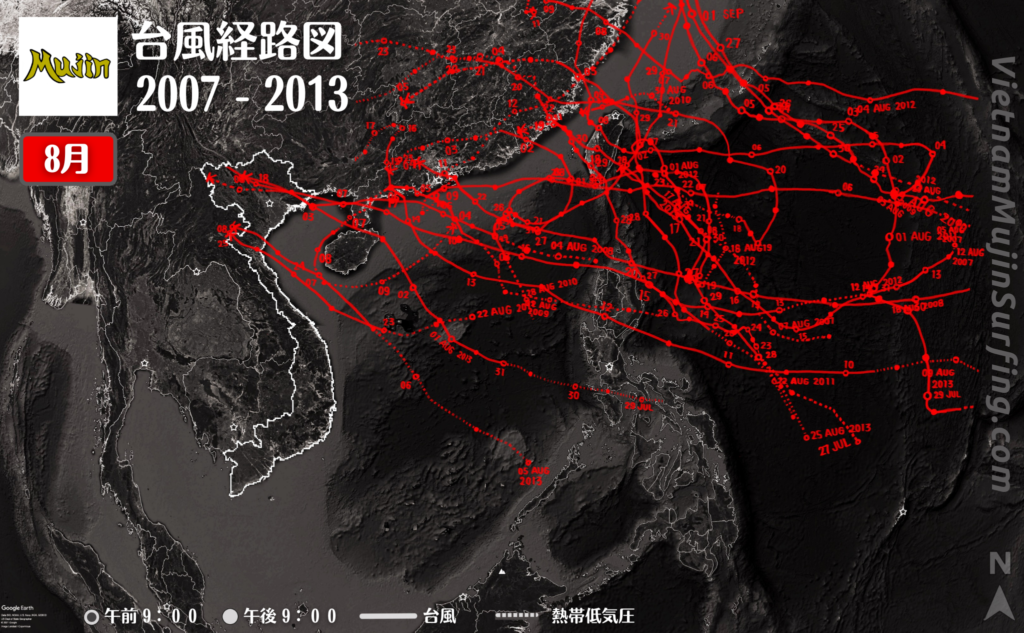
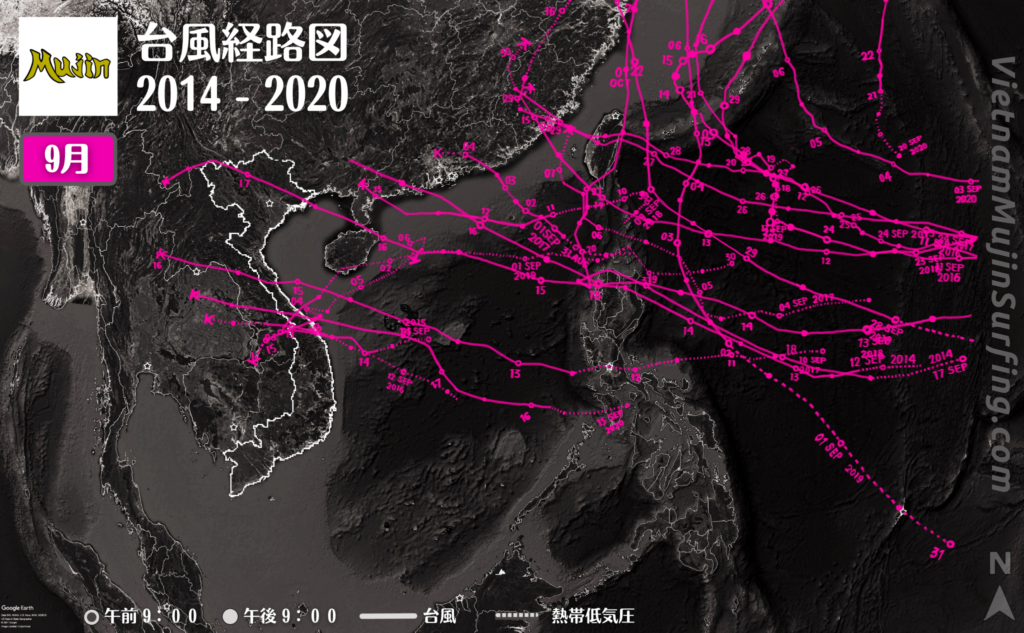
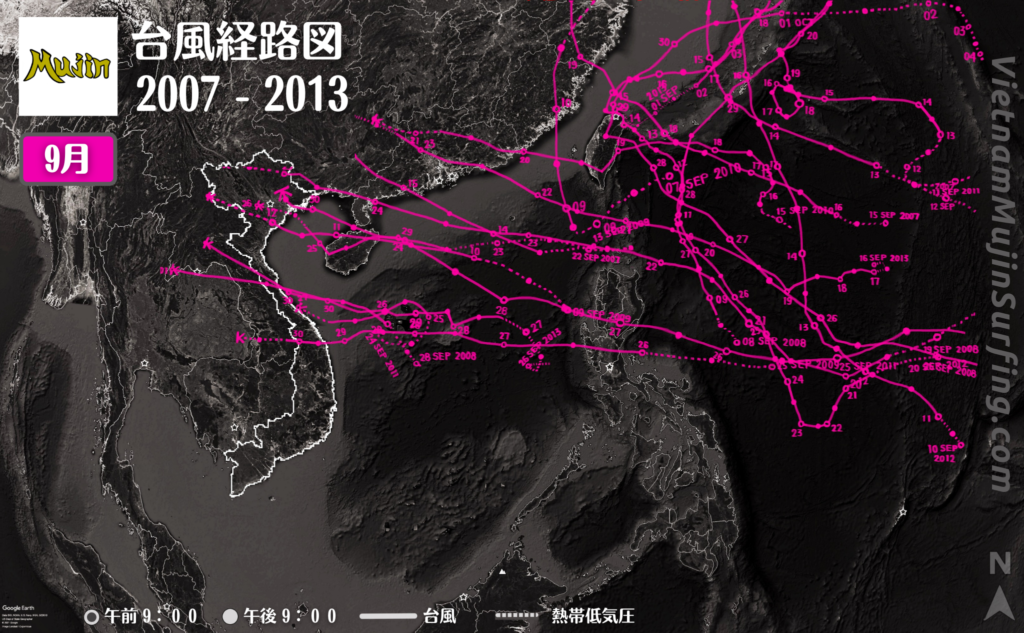
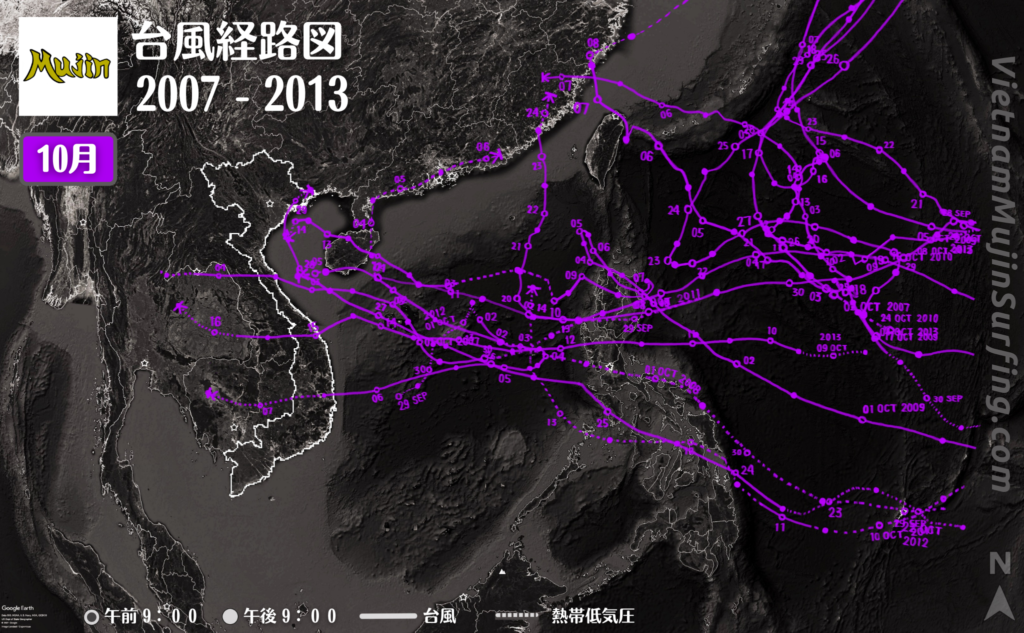
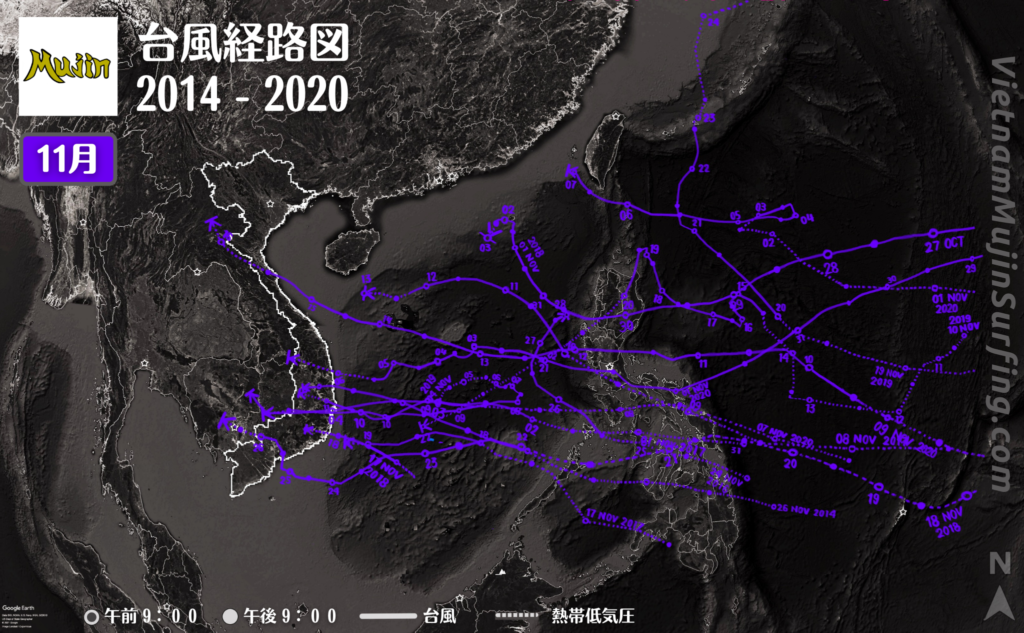
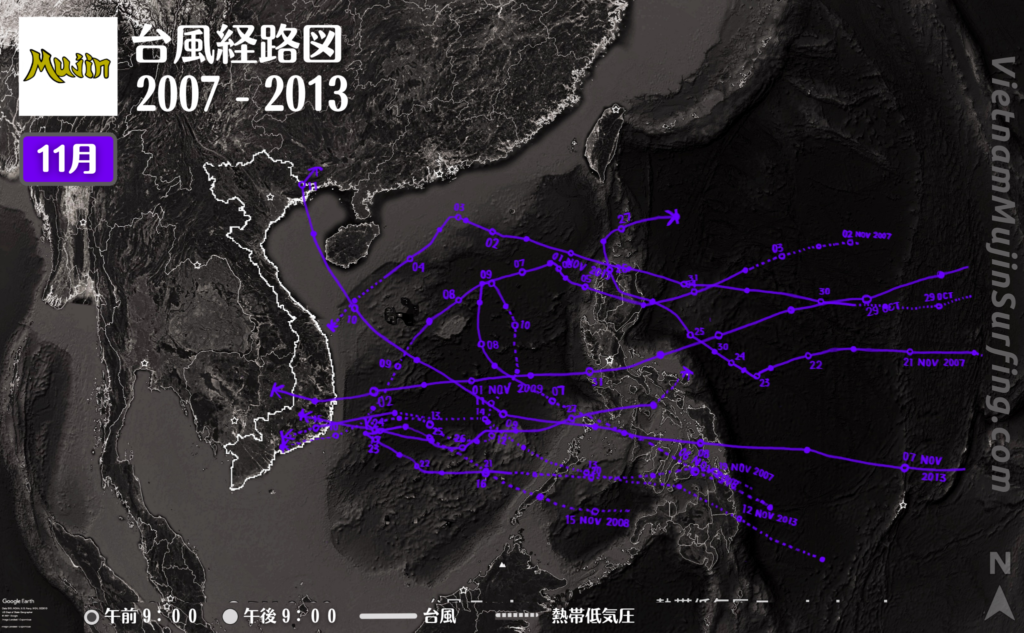
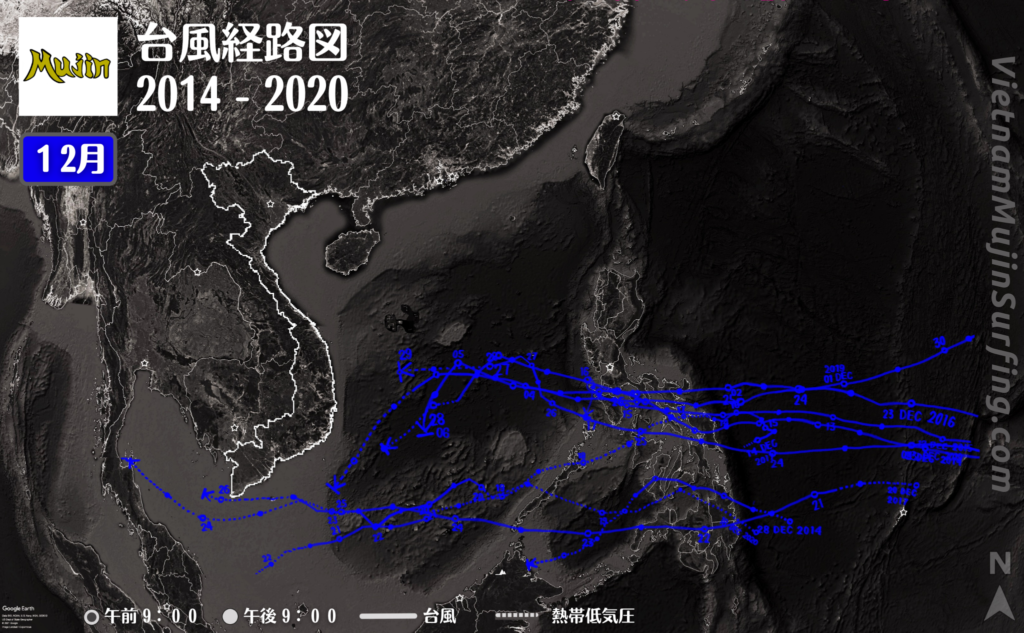
ベトナムの海岸線に影響がありそうな過去の台風経路14年分をまとめました。この資料は、ベトナムの台風スウェルを予測する事を助けます。年度別のまとめでは、どれくらいの台風がベトナム沿岸に接近または上陸しているのかが分かります。また、台風スウェルの当たり年が分かります。月別のまとめでは、季節毎の台風進路の傾向や発生頻度が分かります。この月別資料からは、ベトナムでは夏から秋に台風スウェルの確率が高い事が読めます。
目次
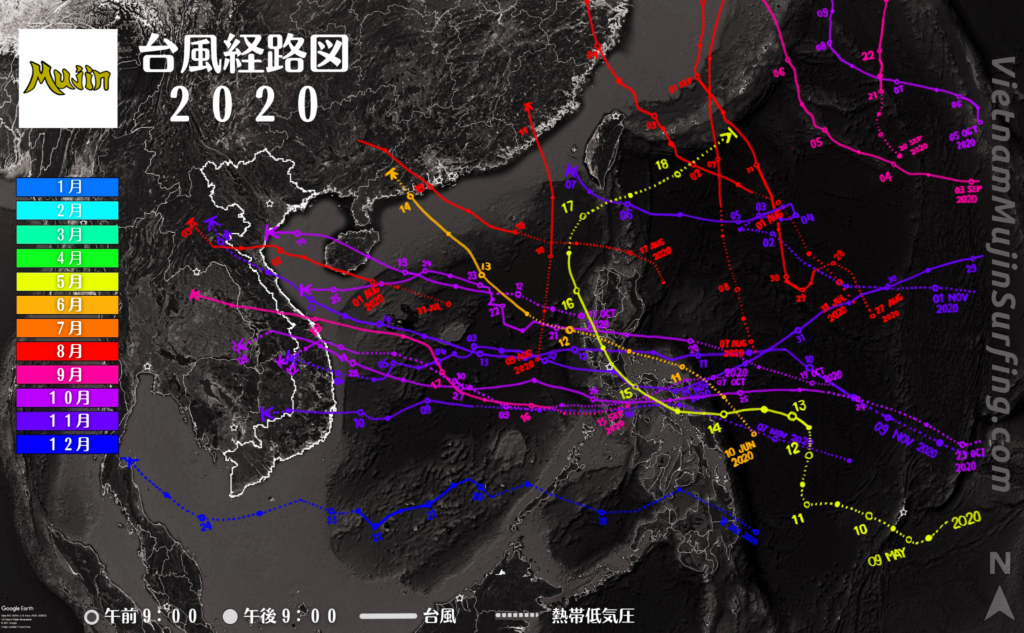
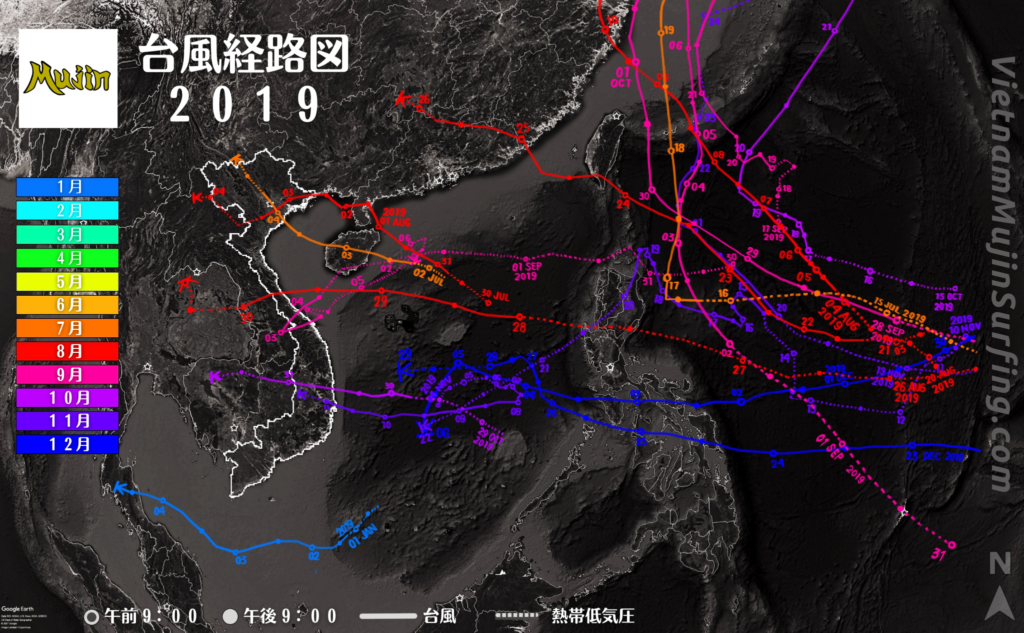
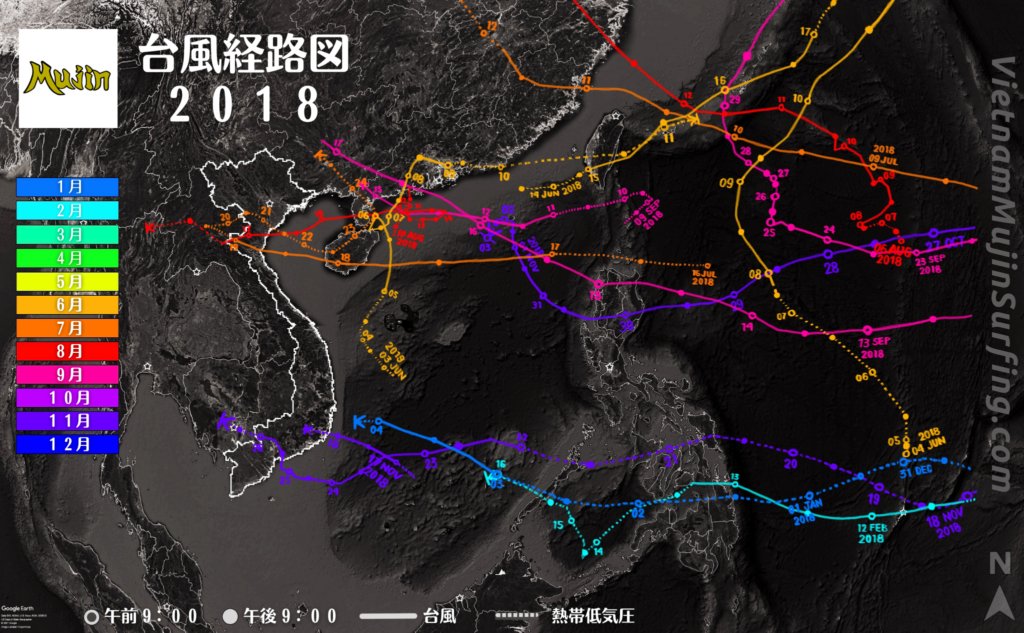
年度別 南シナ海 台風経路図 2020年 – 2007年

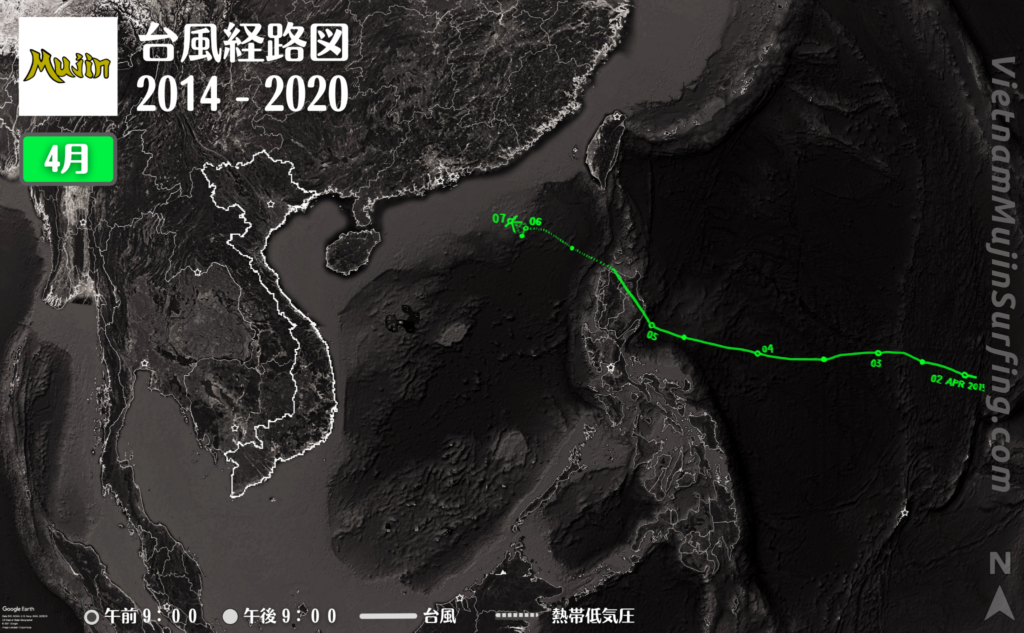
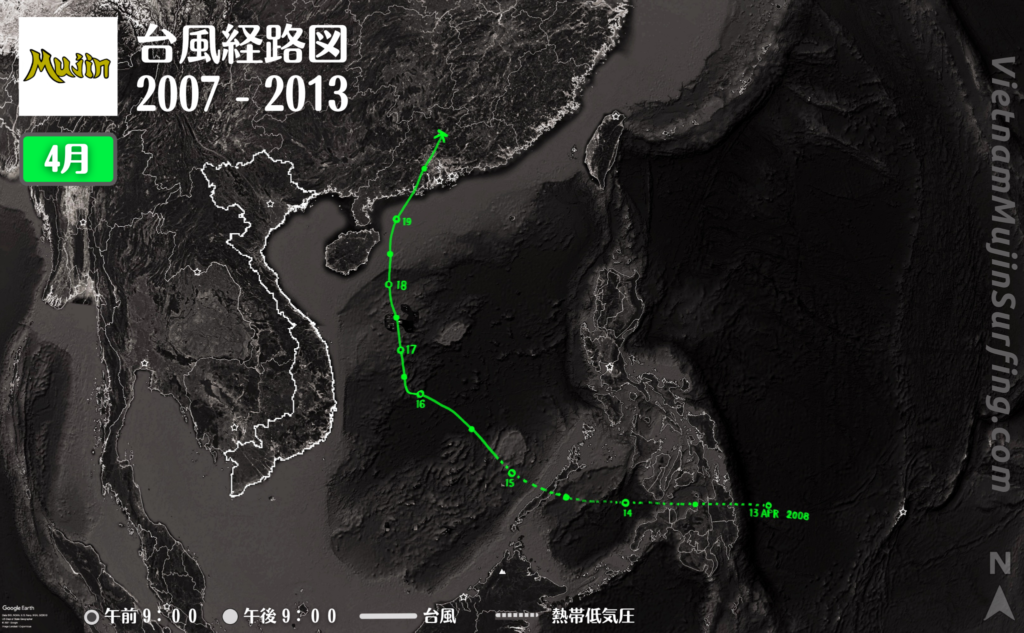
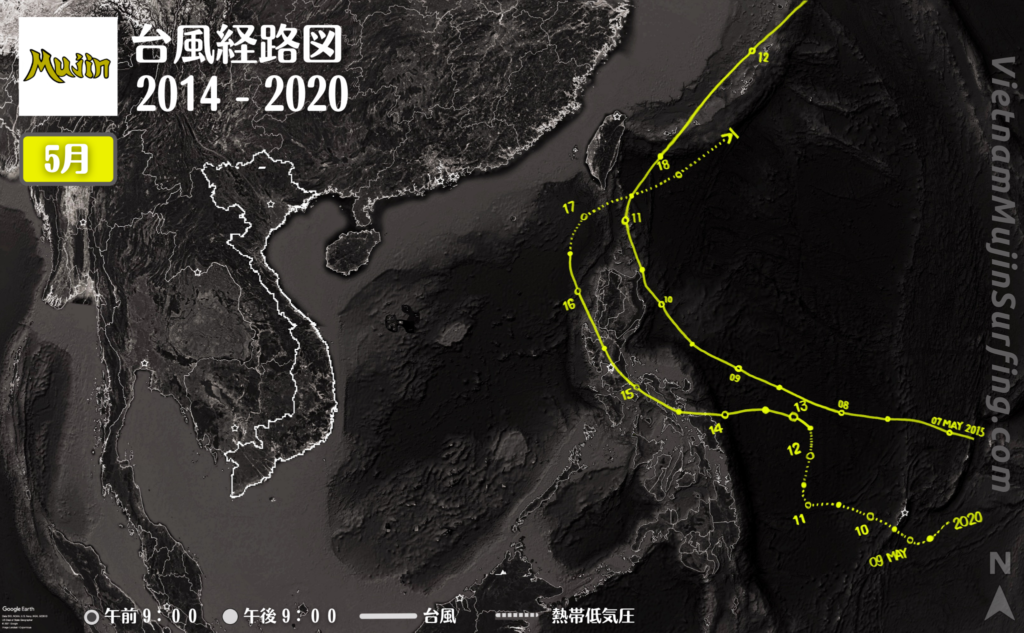
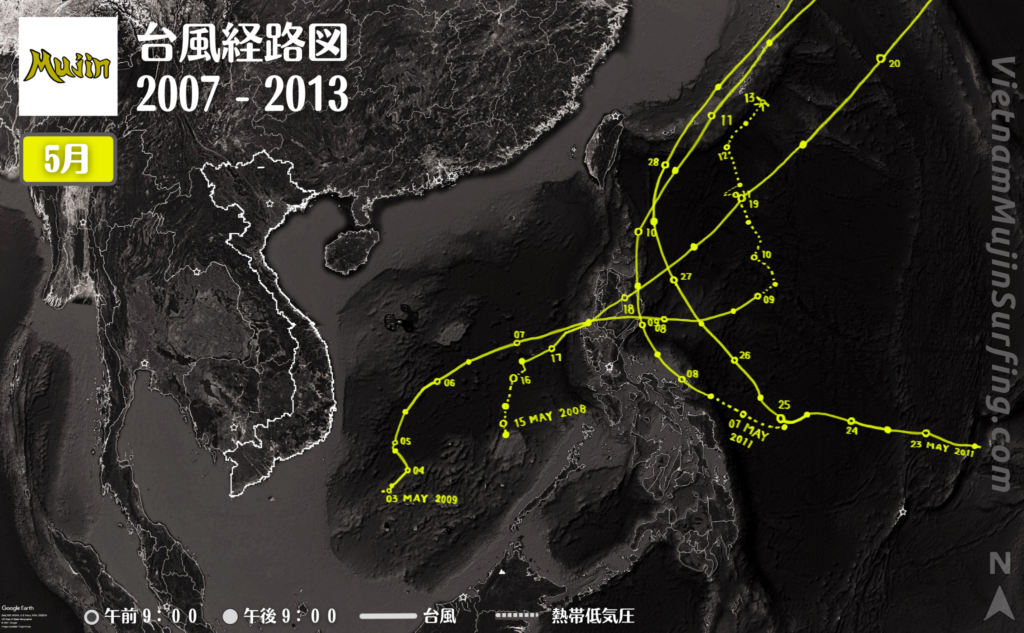
月別 南シナ海 台風経路図 2020年 – 2007年
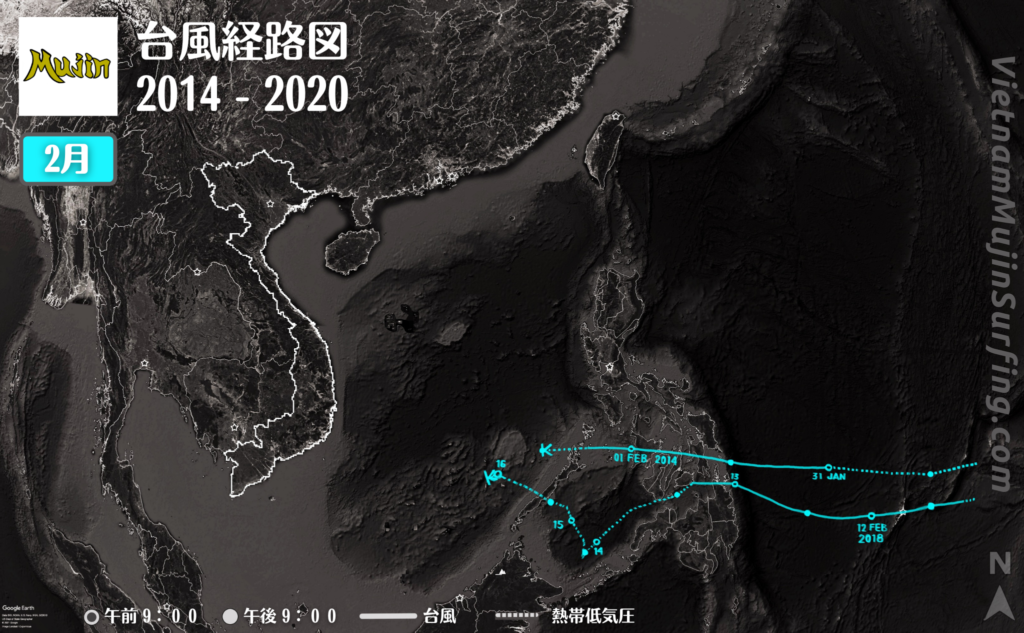
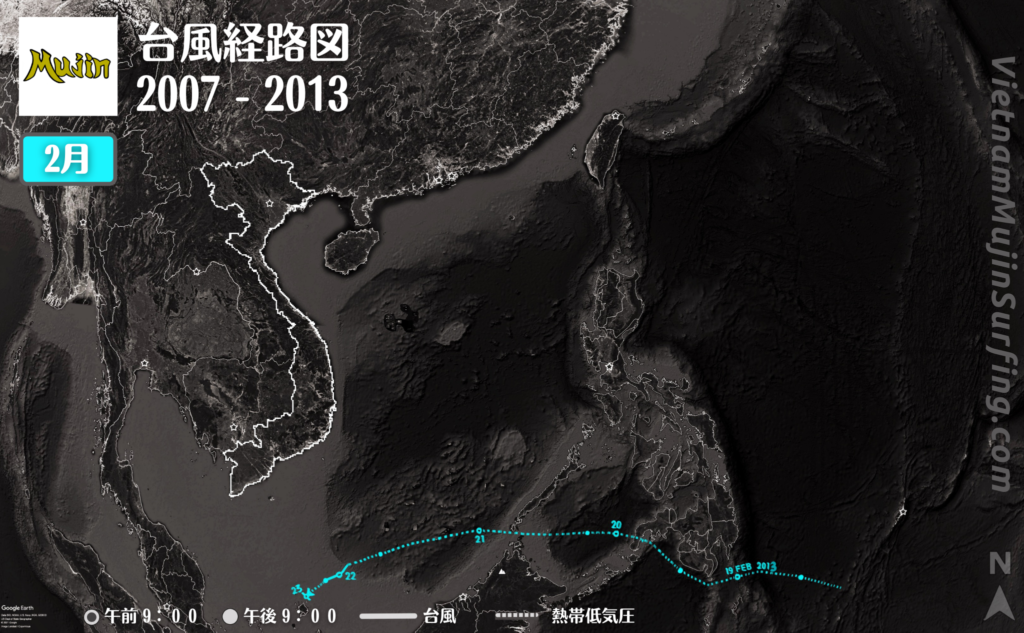
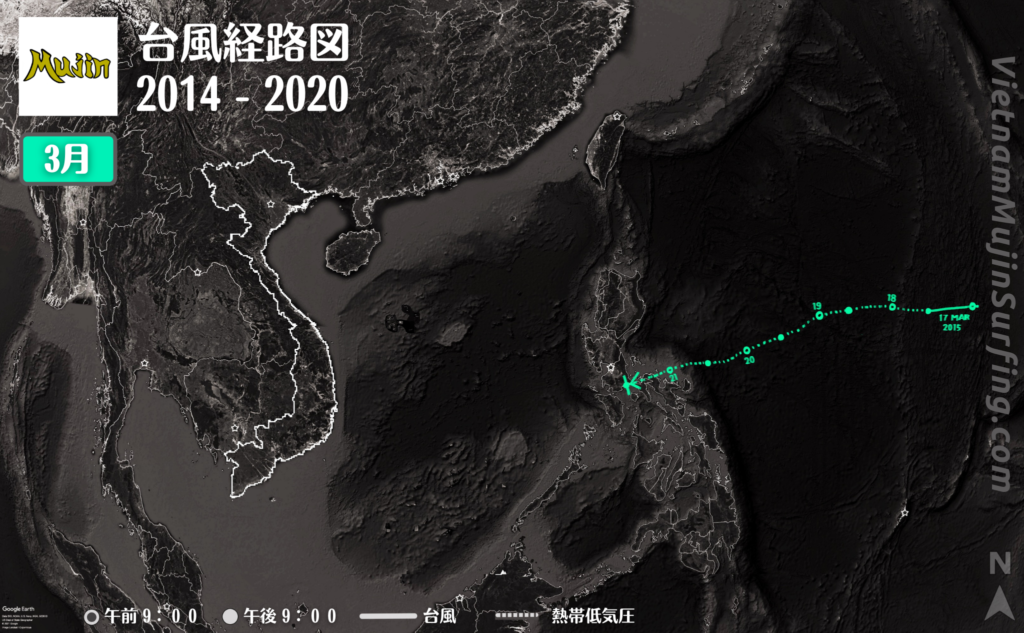
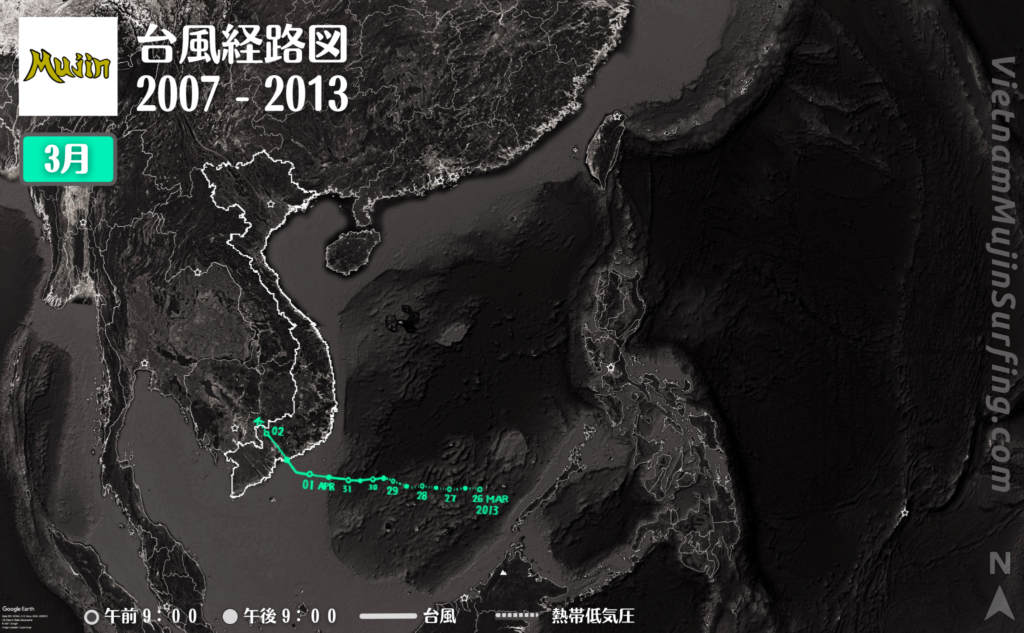
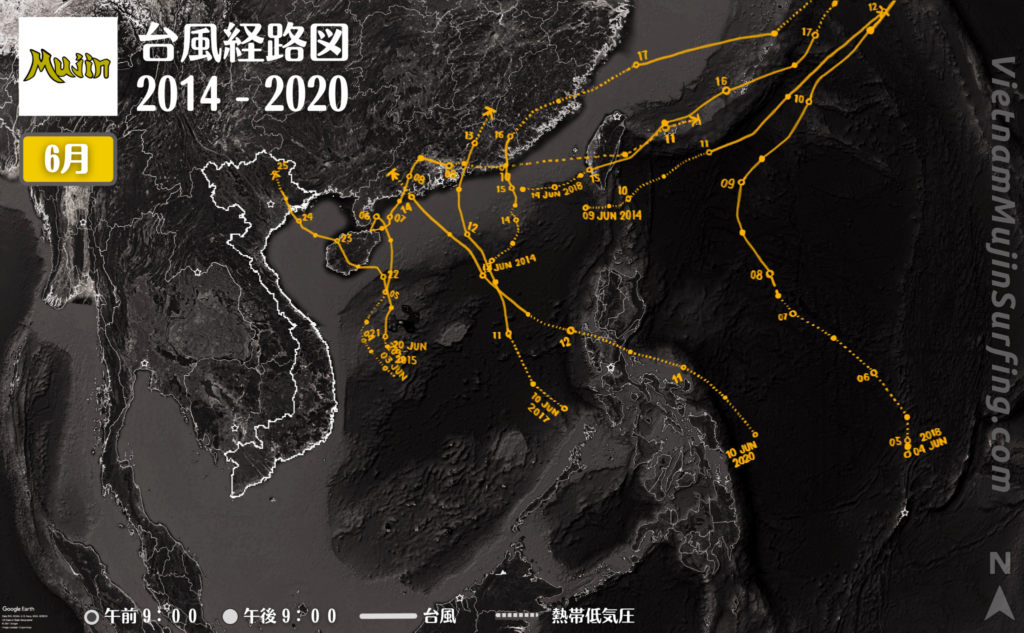
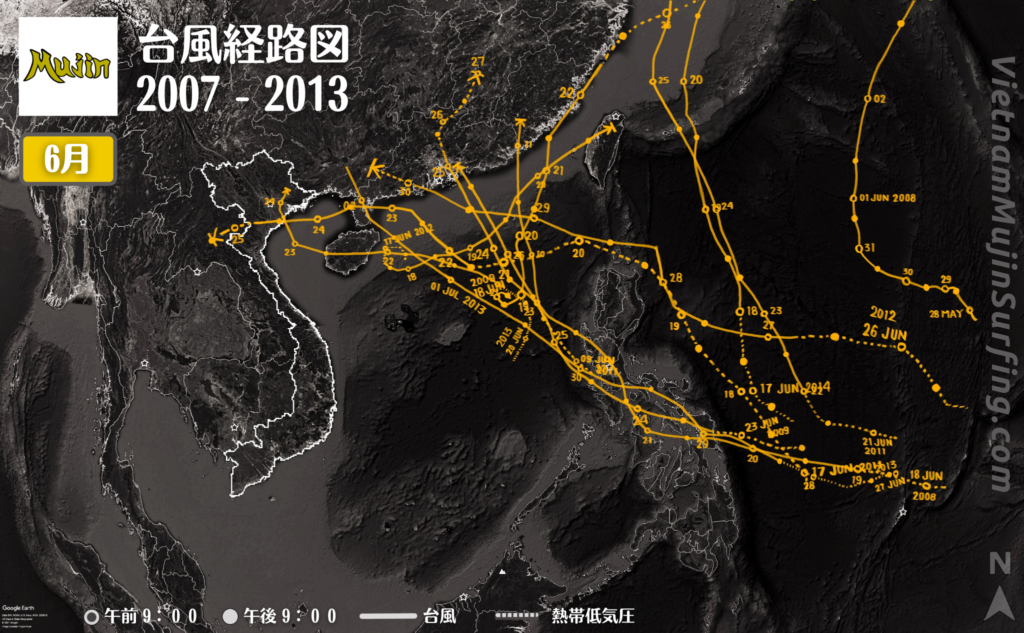
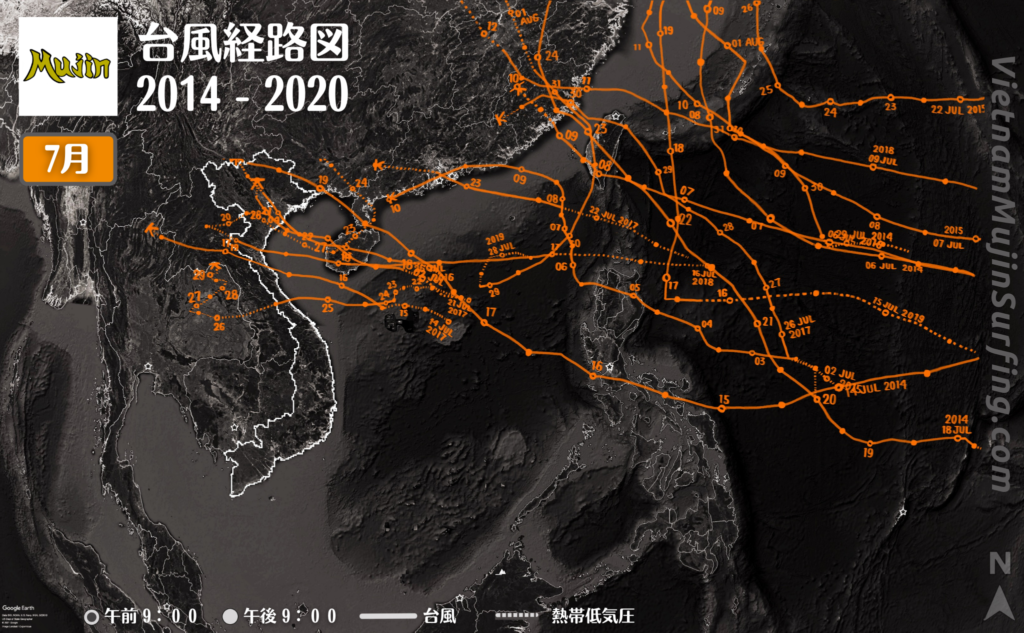
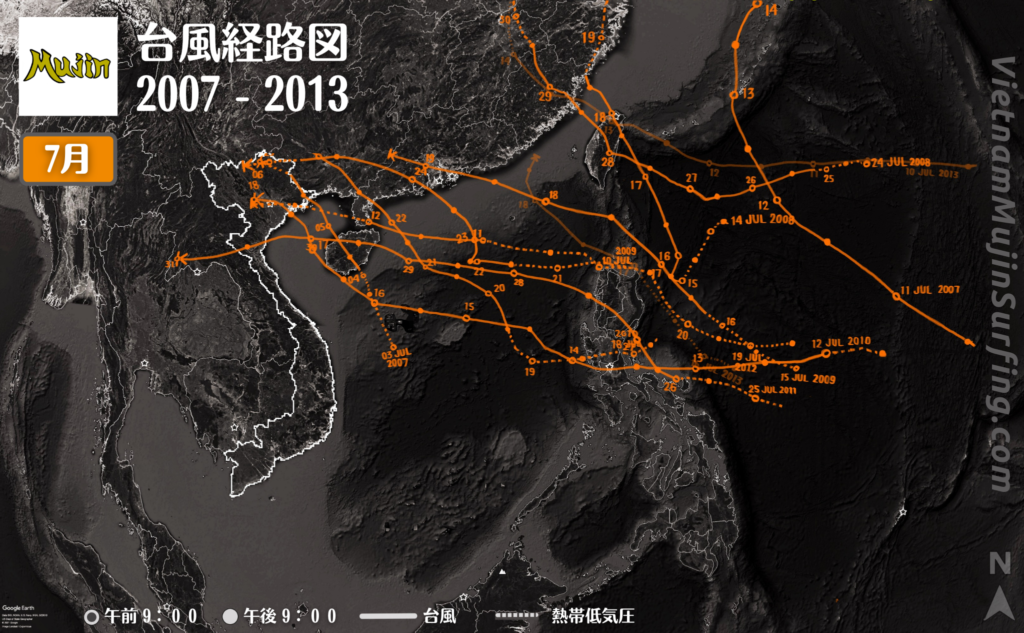

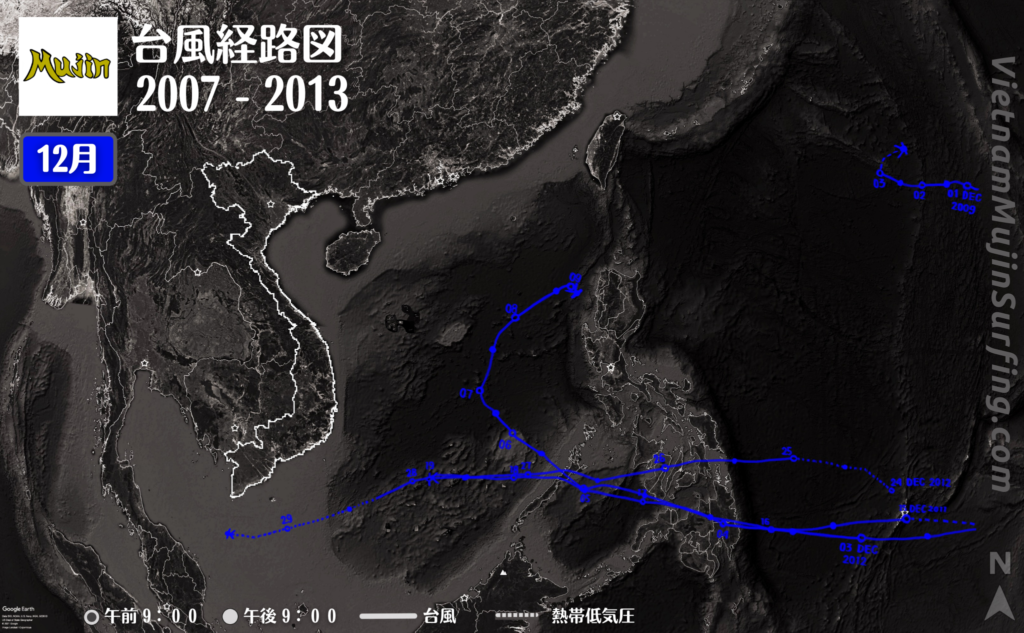
出典:日本気象庁|台風経路図
https://www.data.jma.go.jp/yoho/typhoon/route_map/index.html